← Home NVST.ING

Start Here

START HERE / FIELD GUIDE

A clearer way to prepare for the market.

NVST.ING was built by a trader, heavily inspired by Kristjan Kullamägi, to make the preparation process faster, more organized, and easier to repeat.

This is a preparation and education platform—not an execution tool or financial advice. Market data is delayed, and every setup still requires independent research and judgment.

01 / CHARTING

Build the picture before you build the trade.

The charting workspace is where preparation begins. Sign in with Google to save chart layouts, watchlists, and personal settings across sessions. The data is intentionally delayed because the platform uses Yahoo Finance data, so it is designed for research and preparation—not actionable, real-time trading decisions.

Move through the chart, then use the indicator controls to build context: moving averages, momentum tools, volume, and other technical overlays. The metadata area gives you the company profile and key fundamentals, while the news section adds the story behind the movement. Add a ticker to your watchlist when it deserves another look.
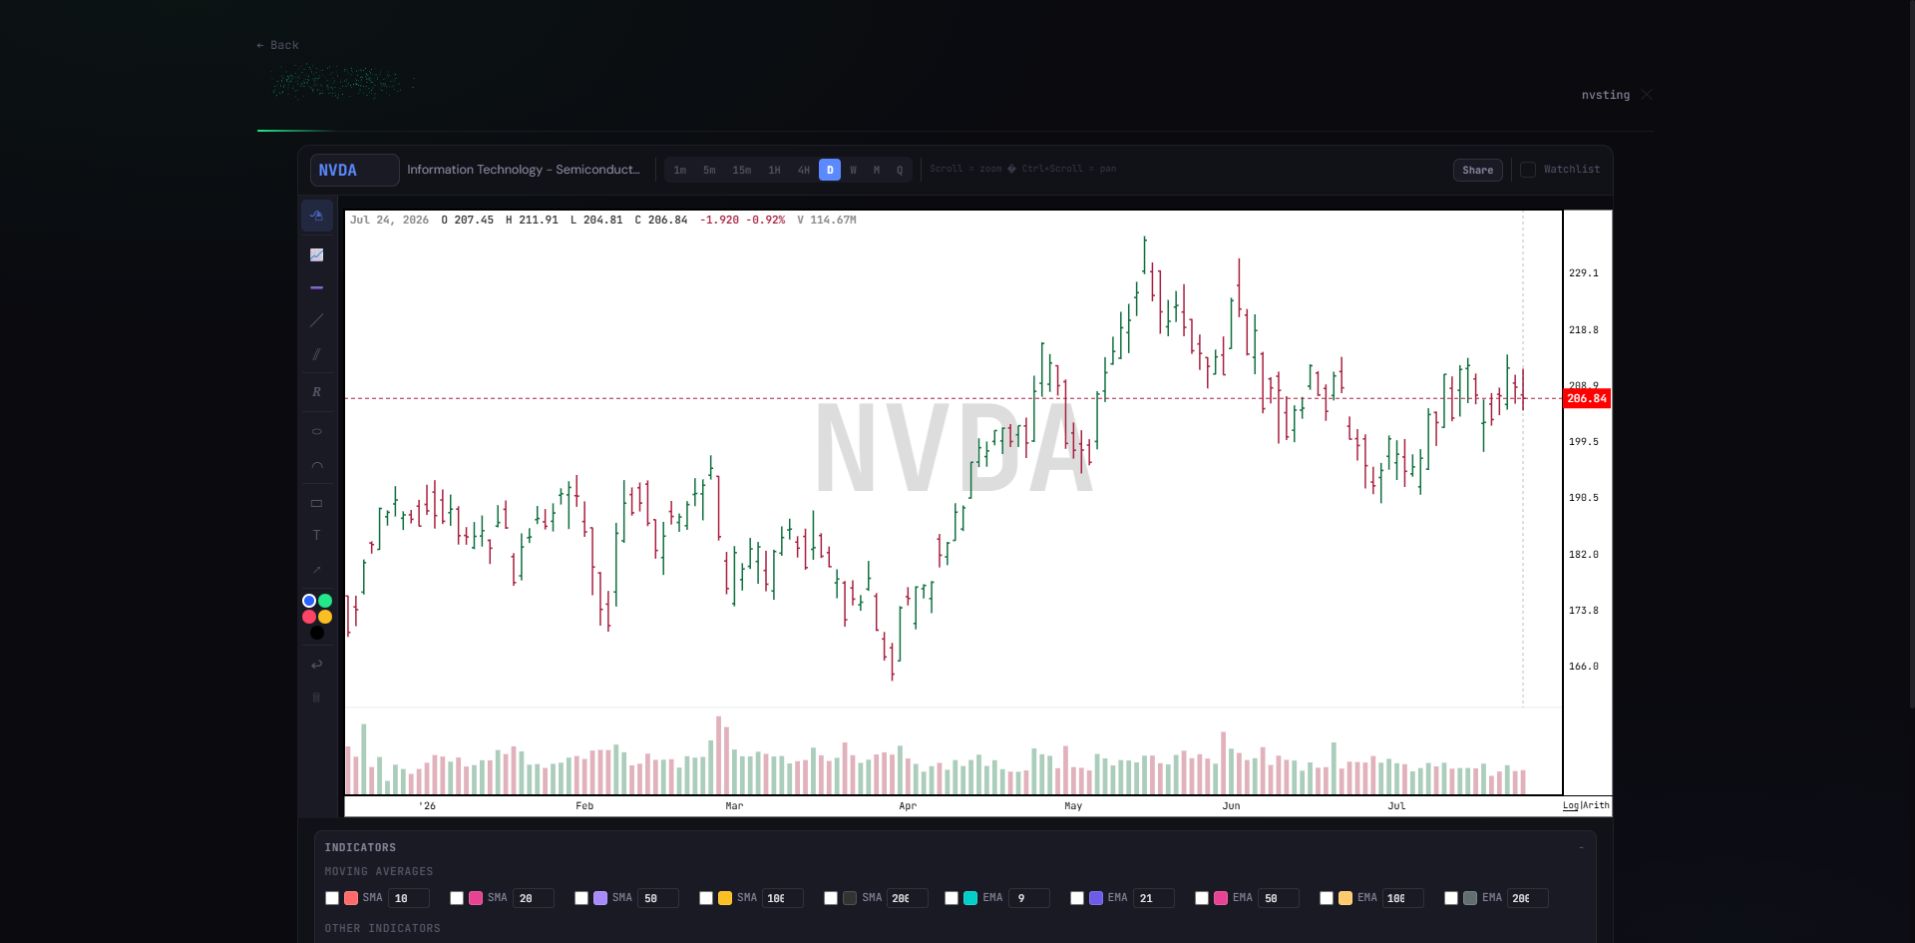
NVST.ING charting workspace showing a candlestick chart and indicator controls
Chart, context, indicators, metadata, and news in one preparation workspace.
02 / MOMENTUM

Find the candidates worth studying.

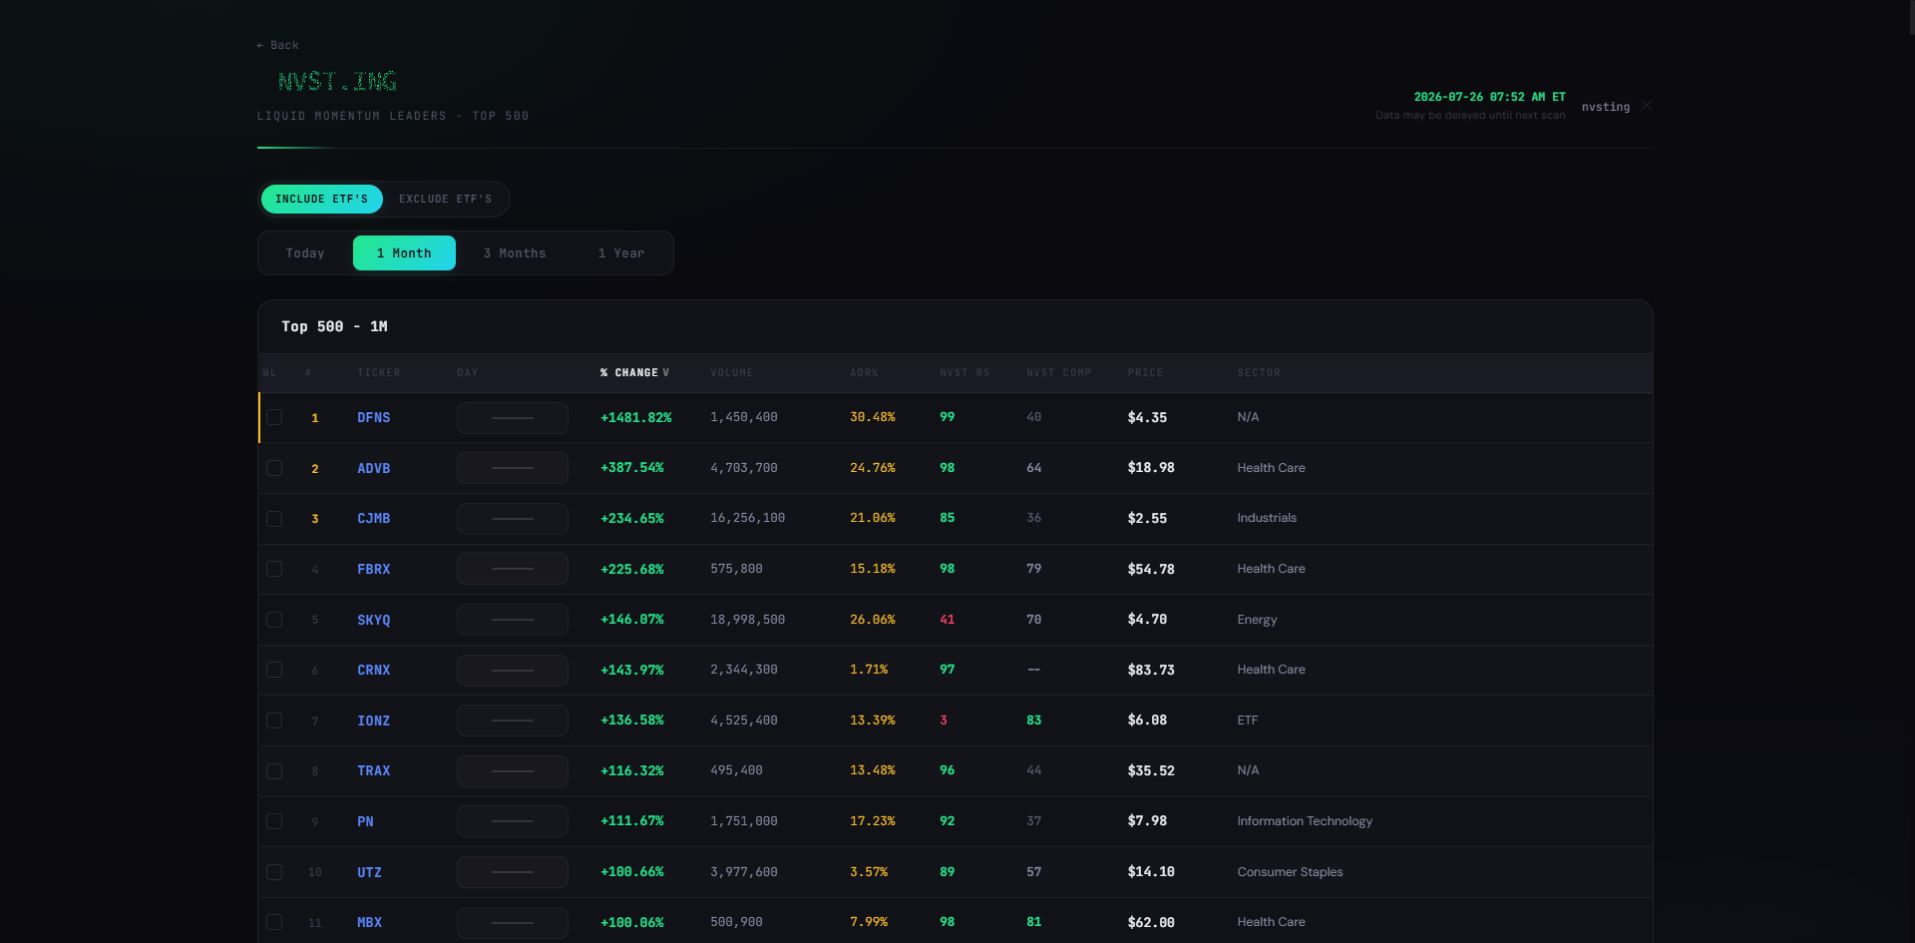
The Momentum Screener follows the same general search for setups that Kullamägi teaches: look for leaders, strong price action, liquidity, and structures that deserve a closer visual inspection. It is not meant to replace the eye. It is meant to help you find where to look.

Hover over a row to browse a setup quickly; the same indicators and chart context carry over from the charting environment. Intraday spark charts show the day’s shape at a glance. The screener also lets you exclude ETFs and only considers names meeting the $5 million dollar-volume threshold.

The proprietary compression score does not reveal its formula. It is designed to approximate the way an experienced trader notices tightening, pressure, and visual structure—an important skill that is difficult to reproduce with purely quantitative rules.

NVST.ING momentum screener showing ranked leaders, sparklines, indicators, and sectors
Ranked momentum leaders with hover-ready rows, spark charts, and sector context.
03 / INDUSTRY MONITOR

Follow the groups that are actually moving.

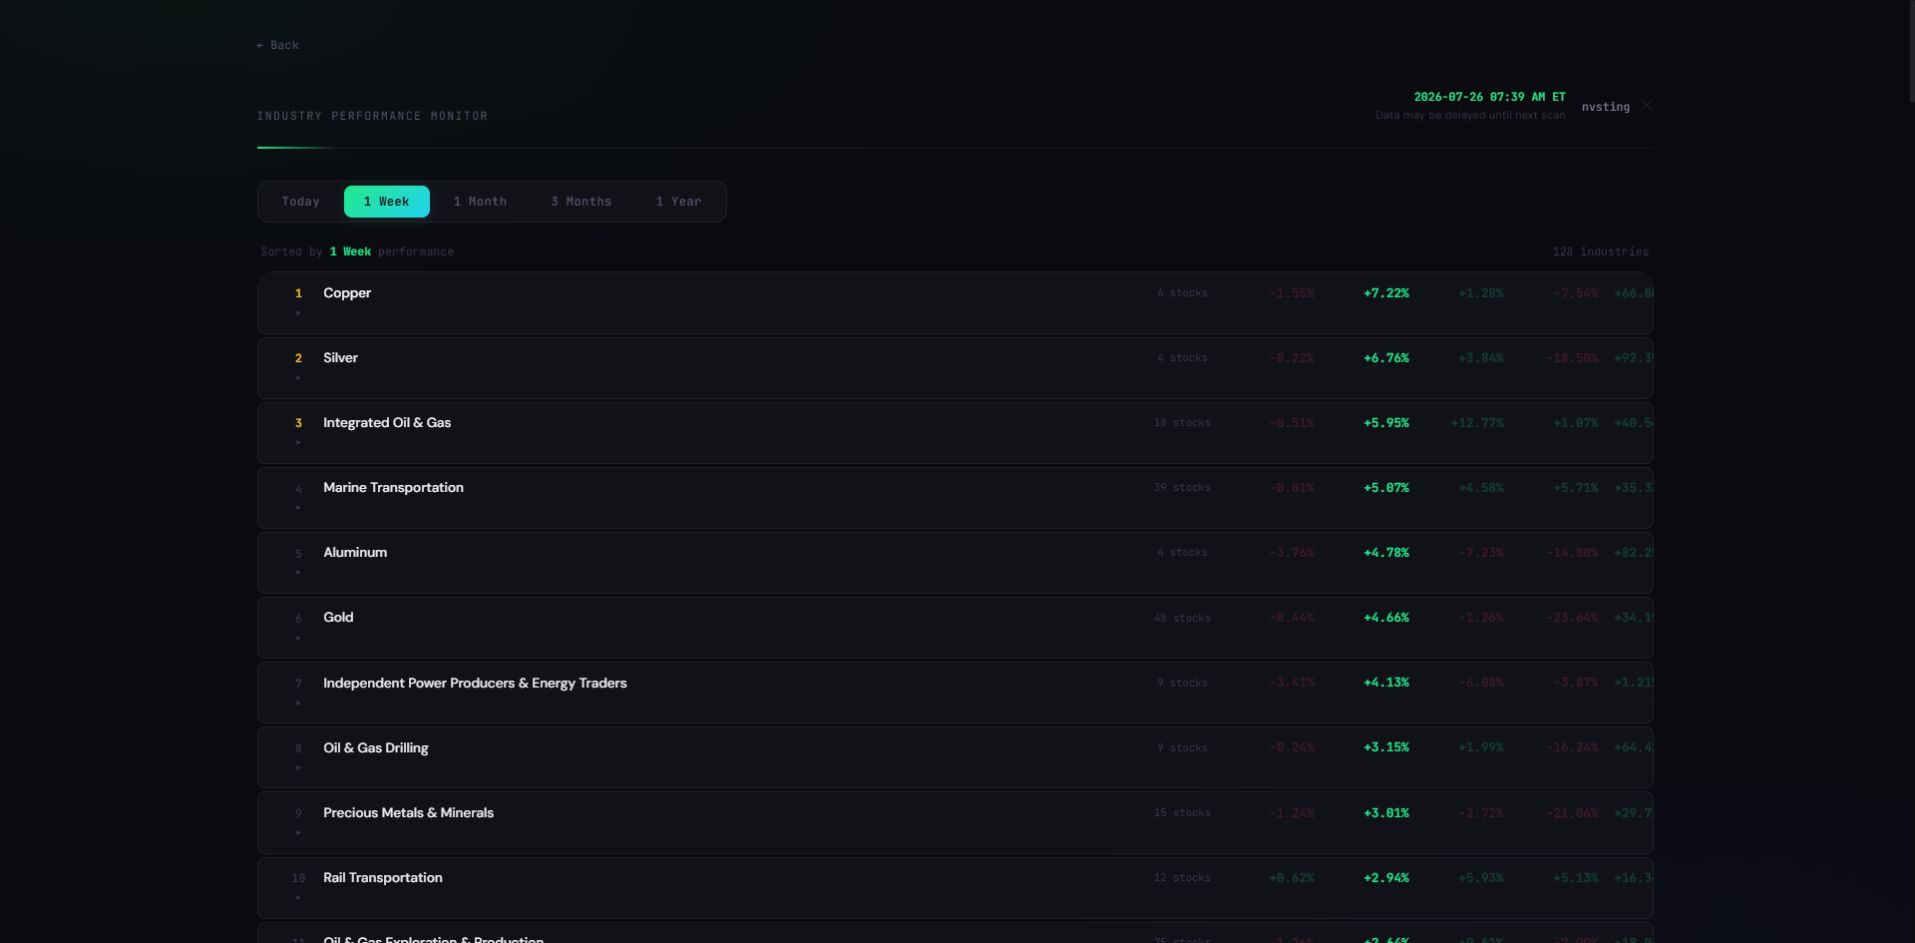
The Industry Monitor reflects a CAN SLIM influence: strong individual stocks are more useful when their broader group is participating. NVST.ING uses GICS classification to map the scanned tickers into industries and track each basket’s performance over multiple timeframes.

Click an industry to open its basket and inspect the underlying companies. This makes it easier to move from a leading group, to its strongest names, to the charts that deserve deeper work.

NVST.ING industry performance monitor showing ranked industry baskets
Clickable industry baskets connect group strength to individual names.
04 / TREND + BREADTH

Keep the market’s wind at your back.

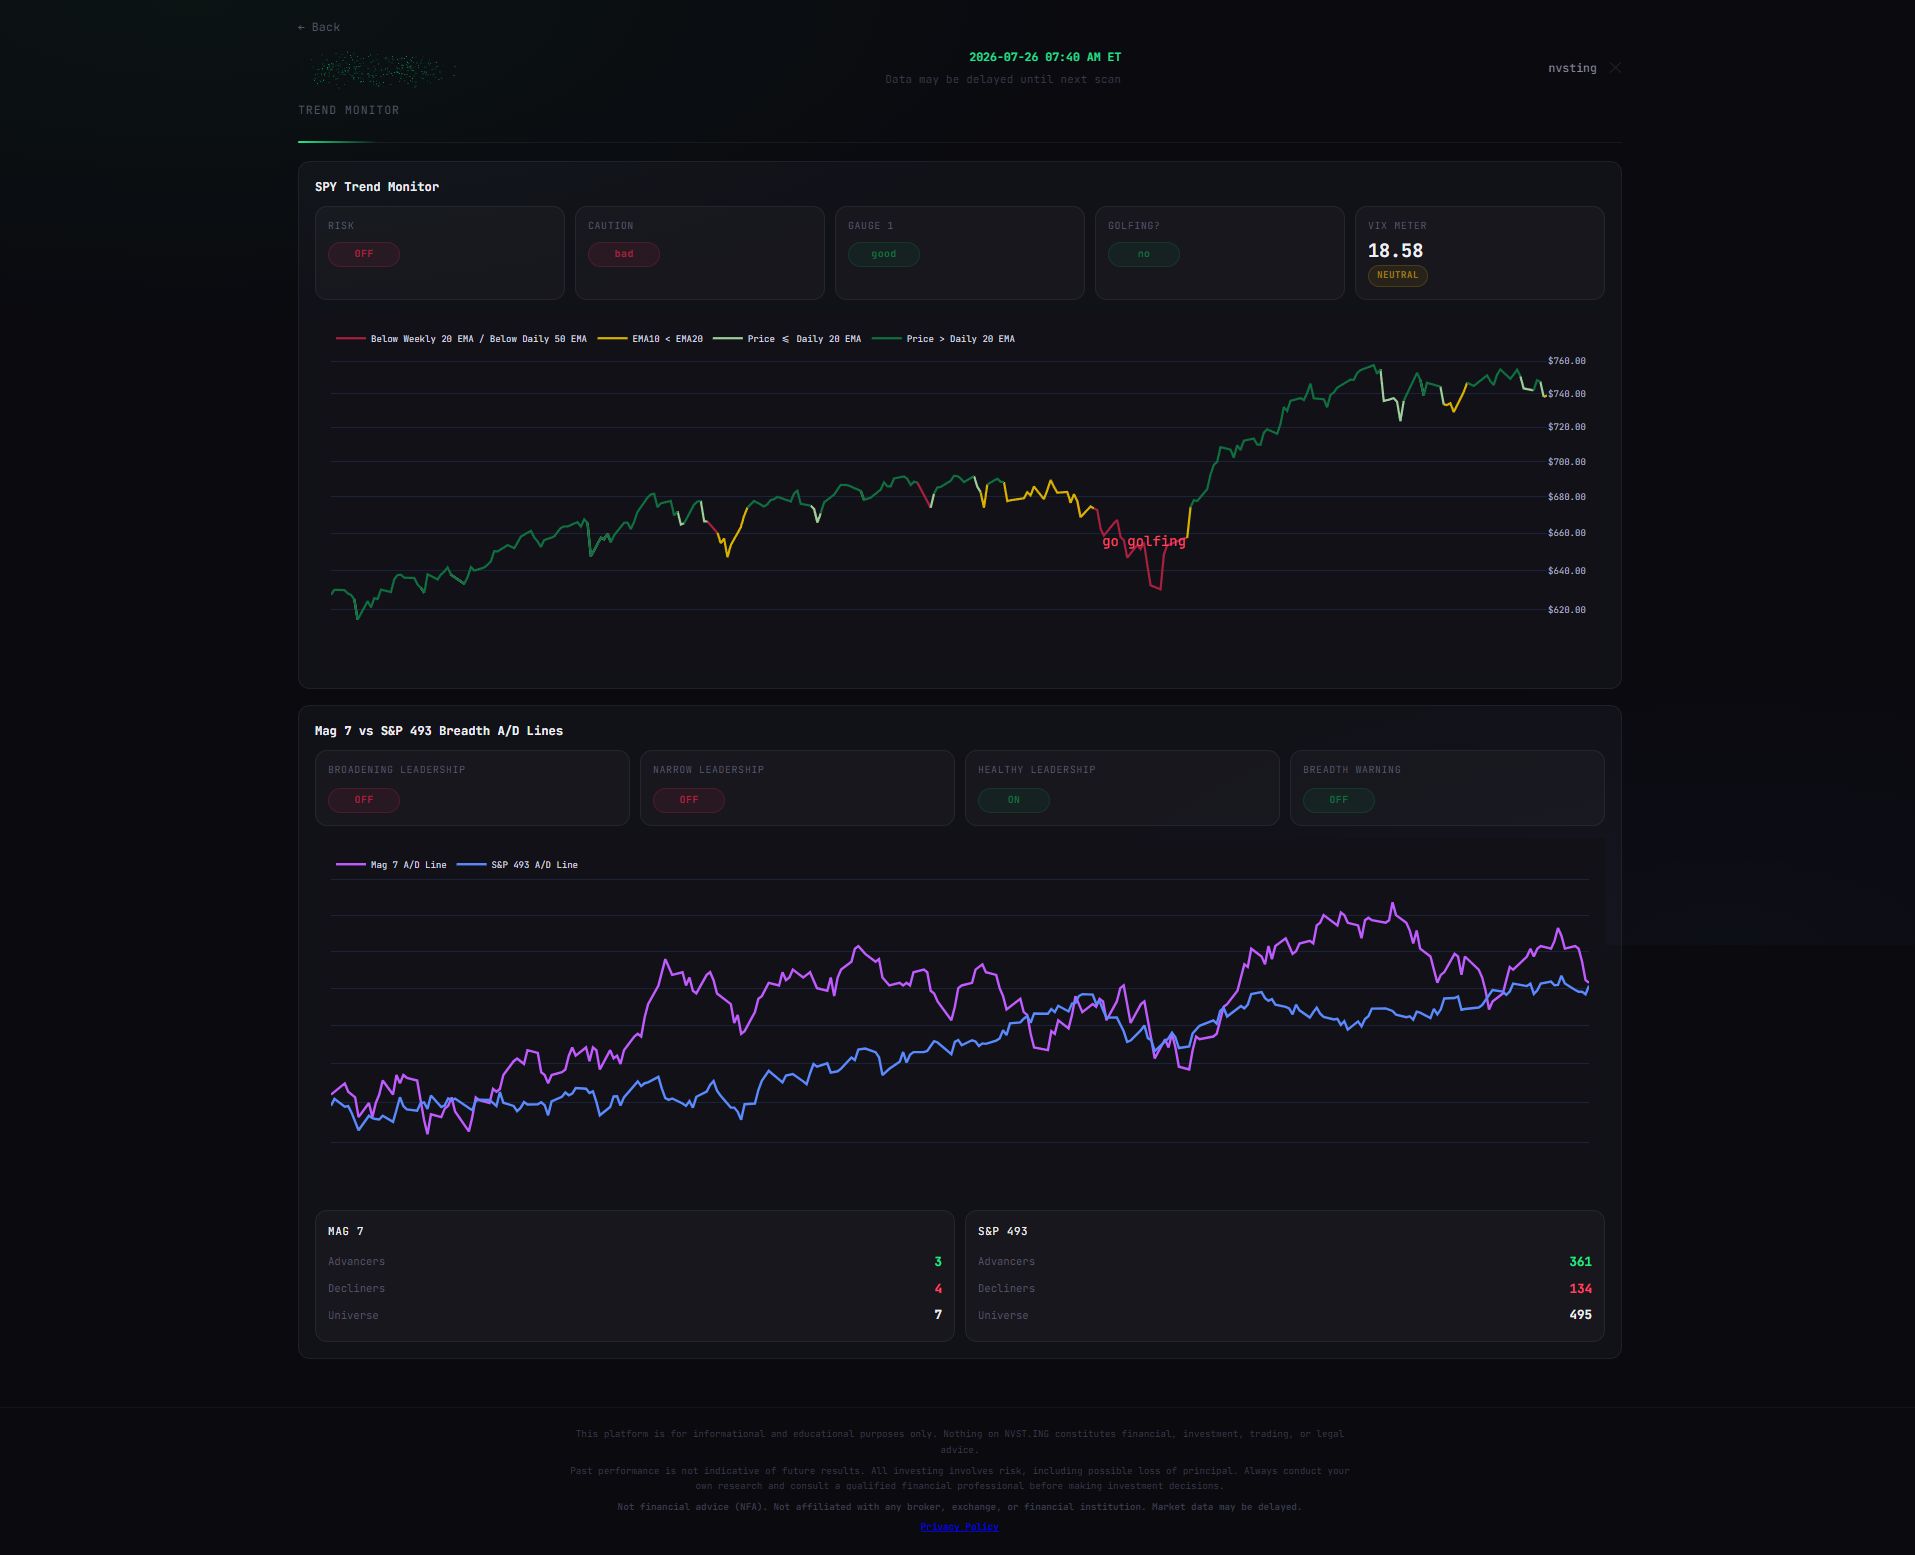
The Trend and Breadth monitors are designed around one practical goal: avoid roughly 80% of the bad market conditions and participate in roughly 80% of the good ones. They help keep the process aligned with the market instead of forcing trades against it.

When conditions are healthy, you are sailing with the wind at your back. When breadth deteriorates, you are rowing against the current. The monitors provide a wider perspective before you spend time on individual setups.

NVST.ING trend and breadth monitors showing SPY trend and breadth charts
Trend and breadth monitors keep the market environment in view.
THE LONG VIEW

The belief behind this platform is simple: with disciplined preparation, better context, and a repeatable process, NVST.ING can help locate and participate in many significant winning trades over the years. The work is still yours—the platform is here to make the work clearer.

This platform is for informational and educational purposes only. Nothing on NVST.ING constitutes financial, investment, trading, or legal advice.

Past performance is not indicative of future results. All investing involves risk, including possible loss of principal. Always conduct your own research and consult a qualified financial professional before making investment decisions.

Not financial advice (NFA). Not affiliated with any broker, exchange, or financial institution. Market data may be delayed.

Privacy Policy